The Mystic's Almanac

It’s long been a dream of mine to have a side business making little projects for people. I like the idea that I can be the means by which someone gets an idea off the ground, for at a price that we can both be happy with. But it’s hard to bootstrap; you need clients to get experience, and you need experience to get clients. I’ve never really tried to make something happen in this area because it seemed like a big effort to get over that particular hump, and I was keeping plenty busy with hobby projects and full-time work.
Thankfully, I was approached by Gabriel Broussard with the perfect opportunity. Gabe and I met many years ago on Twitter, where, as Vivid Void, he dons a spectacular tiger face and dispenses deep wisdom intermixed with meditation memes. Gabe has been leveling up his content and services for some time, culminating in the release of The Mystic’s Almanac, a daily calendar of practices for awareness, centeredness, and healing. There are also beautiful essays, and art, and lots of other goodies. It is a true labor of love.
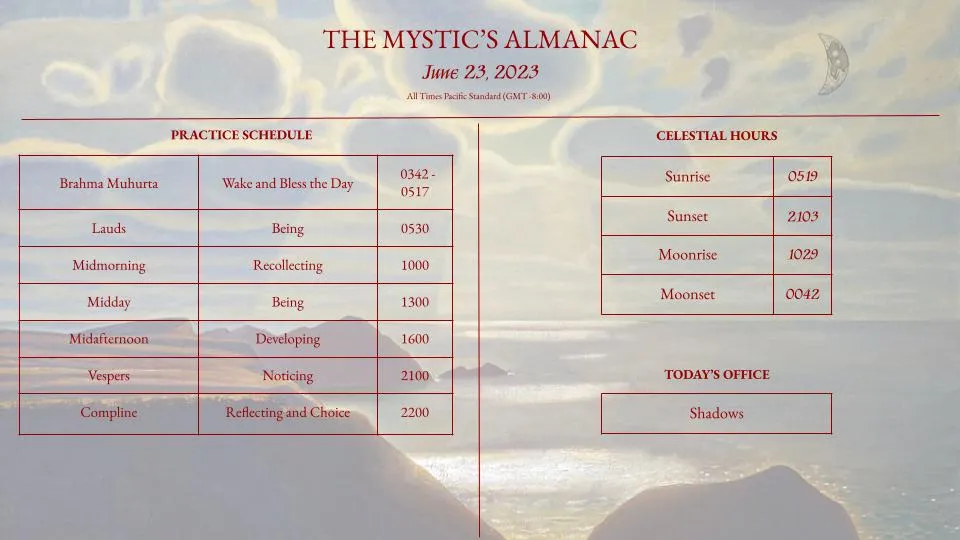
Gabe sends out an email to his subscribers every morning with a chart of suggestions for things to do at certain times of day. Some of these times are in at, or in relation to, sunrise, sunset, moonrise and moonset, which vary by time depending on a subscriber’s latitude.

The chart shows the time for Portland, Oregon, but Gabe wasn’t satisfied with making his subscribers do the work of figuring out their local astronomical transit times. He wanted an interactive chart where a user could input their location and see exactly the times that are relevant for them.
And, luckily, he came to me. I was thrilled by this project as a way to cut my teeth on freelance work. It’s so well-scoped! There is a completed chart that I can use as a mockup, and it was very easy to nail down every requirement (responsive design, way for Gabe to input the correct values per day, etc.) into a single doc that would form my backlog for the project. My time is tight as I juggle work, family, and my hobbies, and Gabe had an aggressive deadline, but it was so well-thought out and the limits were so sharply defined that I could easily see that I could complete this work on time with plenty of wiggle room.
I used Next.js for the frontend for its excellent developer experience, making it a breeze to set up my two routes and lay the groundwork for fetching various data from various servers. Then I recreated the look of the chart as best I could, using a variety of fun flexboxes to get the perfect column collapsing behavior when viewing on mobile. Then, I hooked a location API service to a Material autocomplete component to allow users to type their city name.
I used the ipgeolocation.io API to query for my sun and moon events given latitude and longitude coordinates passed from the location selection component. There was some async order of operations stuff to figure out here but when it all came together, it worked really well. To cap off this portion, I stored location data and the day’s astronomical data in local storage, to reduce the need to make backend calls for data that was already available.
Finally, Gabe needed a way to input his instructions for the day. The instructions are all single words that are expanded upon in the Substack. I had originally thought that I was going to have to build some sort of admin panel, but then I remembered AirTable, which I had used very successfully on another project of mine. AirTable is a web-based spreadsheet that has an API that you can query like a database, so it provided the user-friendly UI I needed out of the box. Gabe could load up a month’s worth of instructions at a time if he wanted to, and I could programmatically grab the day’s instructions very easily.
Once this work was done, it was a simple matter of showing Gabe where in AirTable he could input his data, and the project was handed off. It’s been very cool to see my tool referenced in daily emails, and I hope that it’s adding value to Gabe’s readerbase. If you want, you can check out the app here!
I had a lot of fun on this project, and would love to do something like it again. If you have a great idea for a web app but don’t know how to write the code to make it happen, hit me up! Maybe we can make something cool together.


